
Mineral exploration and prospectivity software
A phased programme that narrows the search area at each step: from satellite and aerial data to drone surveys, from ground geophysics and geochemistry to the model and borehole location.
A phased programme, from regional to local scale
Exploring a mineral district or aquifer basin means progressively reducing the area on which to invest time and resources. We start with the data already available, integrate it with targeted surveys, and proceed to ground investigations only where the evidence supports doing so.
Each phase concludes with a decision point agreed with the client: proceed, revise the approach or stop. Deliverables are provided in GIS format, with the information needed for verification by third-party technical specialists.
The methods we integrate
Each method measures a different physical or chemical property. Interpretation is strengthened when multiple independent methods converge on the same ground.
| Method | What it measures | Typical application |
|---|---|---|
| Satellite remote sensing | Spectral reflectance, morphology and lineaments | Hydrothermal alteration, structures and area screening |
| Drone magnetometry | Total magnetic field | Structures, intrusions and lithological contacts |
| Radiometry (gamma-ray spectrometry) | Natural radioactivity of K, U and Th | Lithologies, alteration and soil mapping |
| Gravity survey | Density variations | Basins, dense bodies and basement geometry |
| TDEM | Resistivity at depth | Conductors, aquifers and saline intrusions |
| ERT/IP | Resistivity and chargeability | Disseminated mineralisation, clays and aquifers |
| Seismoelectric survey | Electrokinetic response of fluids in pores | Saturated layers, relative porosity and permeability |
| Geochemistry | Elements and isotopes in soils, sediments, rocks and water | Geochemical vectors and water signatures |
Downhole measurements – geophysical logs and well video inspections – reach depths of up to 1000 m.
From satellite to borehole location
Four levels of investigation, each covering a smaller area and providing greater detail. Each phase concludes with a decision point – proceed, revise the approach or stop – and results are provided in GIS format for verification by the client.
- 01
Satellite and existing data
1.000–10.000 km²
Multispectral and hyperspectral imagery (Sentinel-2, ASTER, PRISMA, EnMAP), radar and digital terrain models, together with geological maps, airborne geophysics and well records. We identify lineaments, alteration and areas for further investigation.
- Sentinel-2
- ASTER
- PRISMA
- EnMAP
- Radar and DEM
- 02
Drone surveys
10–100 km²
Over selected areas, drone-based magnetometry and gamma-ray spectrometry (K, U, Th) are carried out using VTOL fixed-wing and multirotor platforms operated by specialist technology providers. The anomalies narrow the search to a few sectors.
- Magnetometry
- K-U-Th radiometry
- LiDAR
- 03
Ground geophysics and geochemistry
1–10 km²
Gravity surveys, TDEM, ERT/IP surveys and seismoelectric soundings investigate anomalies at depth; geochemical analysis of soils, sediments, rocks and water helps confirm their nature, in collaboration with the University of Florence.
- Gravity surveys
- TDEM
- ERT/IP
- Seismoelectric surveys
- Geochemistry
- 04
Model and drilling
Borehole location
Data are integrated into a model with associated uncertainty, a ranked list of targets, and borehole or well locations. We monitor drilling using borehole logs and well video inspections.
- 3D model
- Target ranking
- Downhole logs
Mineralised body, halo and boreholes
The diagram illustrates what a phased programme aims to reconstruct: a mineralised body, the surrounding alteration and chargeability halo, which IP can detect before the body itself, the faults that control it, and the boreholes positioned using the model. Shapes and dimensions are illustrative: they do not represent a real deposit or a resource estimate.
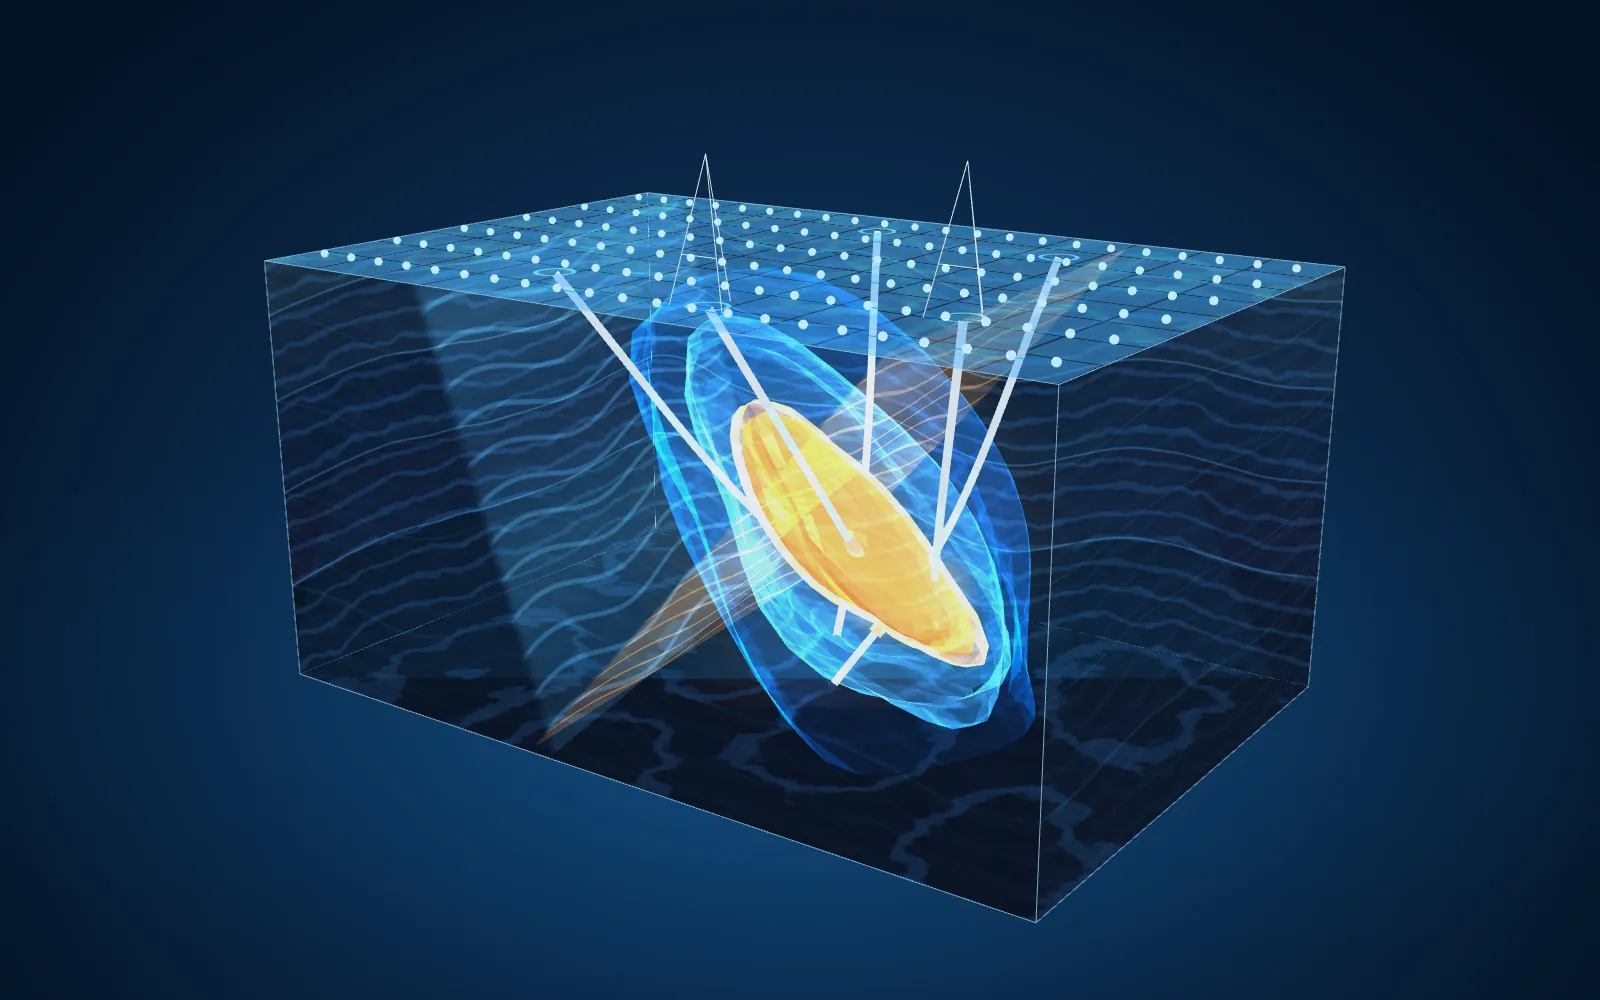
- Mineralised body
- Alteration and IP halo
- Faults
- Boreholes and survey lines
Prospectivity software: in development and validation
With support from university collaborations, we are developing a software tool that integrates information layers – satellite data, airborne and ground geophysics, geology and geochemistry – into probability maps by resource type, with an uncertainty estimate for each cell.
The approach combines two complementary methods: a knowledge-driven approach that translates mineral system models into rules, and a data-driven approach using machine-learning algorithms and spatial cross-validation. Planned testing includes blind validation on areas excluded from training.
The same approach can be applied to aquifer and geothermal reservoir exploration, producing potential maps at district scale.
Current status
The tool is in development and validation; we do not claim demonstrated predictive capability. The maps are decision-support tools and must always be verified through ground investigations.
Images and results
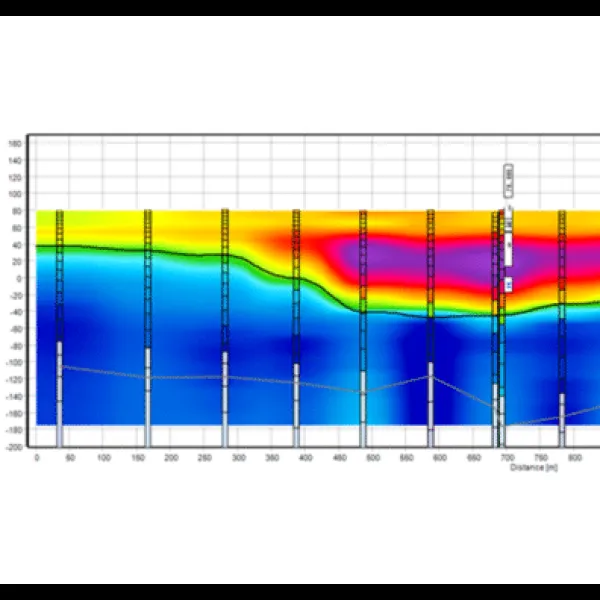
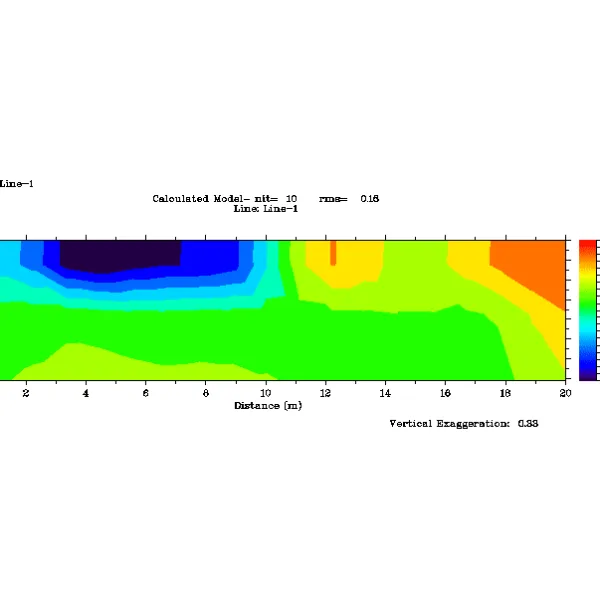
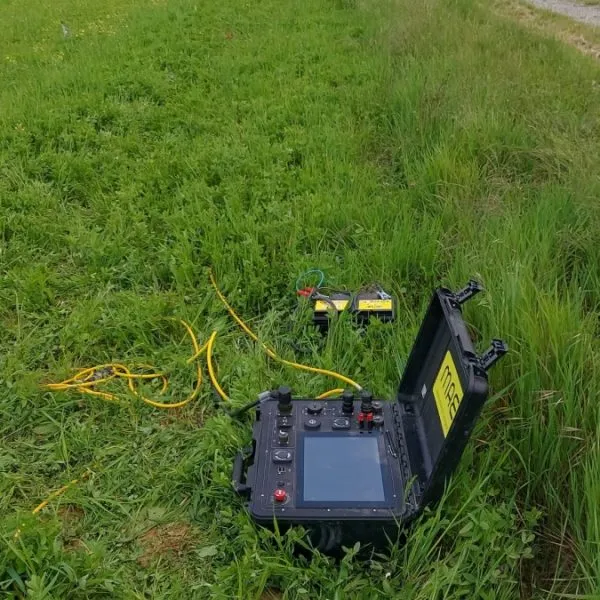
Frequently asked questions
Is the prospectivity software already operational?
No. The software is in development and validation. Prospectivity maps should be treated as decision-support tools to be verified through ground investigations, not as guaranteed predictions.
Where does an exploration programme start?
With a desk-based review of existing data: satellite imagery, geological maps, airborne geophysics and well records. Only areas that meet the criteria at this stage proceed to drone surveys and ground investigations.
Who carries out the drone surveys?
Drone-based magnetometry, gamma-ray spectrometry and any other sensor surveys are carried out by specialist technology providers, under the technical coordination of Sismoelettrica.
What role do the universities play?
Geochemical, mineralogical and petrographic analyses are carried out in collaboration with the Department of Earth Sciences at the University of Florence (UniFI); remote sensing, GIS and training are carried out in collaboration with CGT – Centre for GeoTechnologies, University of Siena.
What does the client receive?
Verifiable GIS deliverables (GeoTIFF and shapefiles), a ranked list of targets with associated uncertainty, a technical report and, if included, training for technical staff.
Often combined with this survey
Book a technical call
Tell us about the area and exploration objectives: together, we can assess the available data, phases and most suitable methods.